1 INTRODUCTION
1.1 Background
Bridges have been constructed to establish direct means of communication and transportation between populations for thousands of years. As construction and engineering technology has progressed, so has the size and number of bridges across the globe. Within the last century there has been unprecedented infrastructure growth, resulting in the construction of bridges that push the limits of their materials and engineering design.
Long span bridges account for only a small percentile of the total number of bridges in use around the globe. However, it is undeniable that these bridges, on a scale of their own, provide vital connections, across; mountains, valleys, bays, rivers, oceans and lakes, that are essential to the daily operation of cities and countries across the globe.
1.2 Project objective
Long span bridges, though vital to many communities, lack representation within a searchable, manipulatable and analysable construct. Due to the internet, information regarding long spans bridges is freely available, to an extent, however, this information is yet to be collected and presented in a meaningful and useful format.
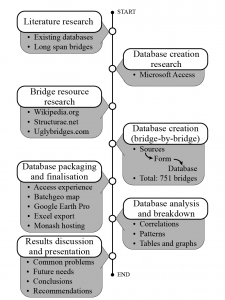
Therefore, this project aimed to conduct a comprehensive survey of long span bridges from across the globe, and with the data collected construct a global long span bridge database. The database was then used to help identify in common problems experienced by long span bridges, and help identify the future needs for long span bridge design and construction.
2 DEFINITIONS AND ASSUMPTIONS
2.1 Global survey
The survey of long span bridges was as globally extensive as available resources and time allowed. The survey included bridges from a total of 81 countries, which were assigned to one of seven global regions, either; Africa, Asia, Europe, Latin America/Caribbean, Middle East, North America, or Oceania. However, the information freely and easily available for each region or country varied greatly. At a minimum, details regarding location and construction were obtained. North America proved to be the most accessible region, largely due to the National Bridge Inventory being freely available online.
2.2 Span
‘Span’ is a term that may be interpreted to relate to different dimensions of a bridge structure. For this project, and in most interpretations, ‘span’ is defined as the distance between to ground supports (pylons) of a bridge structure. For this survey, the maximum (longest) span of each bridge structure is its qualification for being a ‘long span’ bridge, and should not be confused with the overall length of the bridge. See Figure 2 for diagrams clearly defining the ‘span’ dimension for each bridge type included in the survey and database.
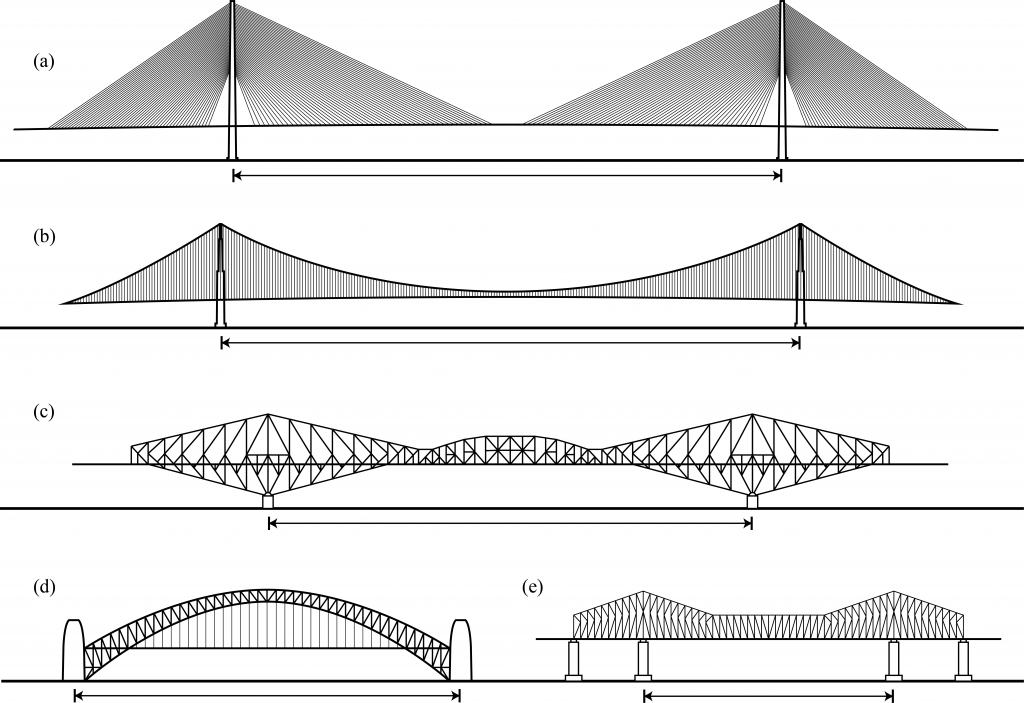
Figure 2. Span dimensions per bridge type used during survey. (a) cable stayed (b) suspension (c) cantilever (d) arch (e) truss
(De Maria, 2017)(Original)
2.3 Long span
The term ‘Long Span’ also needed to be defined in relation to the survey and database. For this project the term ‘Long Span’ was considered a flexible and relative term, meaning; that there was no set length to be greater than, and that it was relative to the bridge type.
However, it was also determined that, there is a point where the mechanics and effort required to span a given distance becomes so common place that it is no longer irregular, or special. Box girder bridges, usually associated with ‘short span’, or more common span lengths, can span up to approximately 150 metres. Therefore, to eliminate technology associated with smaller spans, a target was set to obtain details on all bridges across the globe with a main span greater than approximately 150 metres. (Hewson, 2003)
2.4 Design life
The concept and definition of ‘Design Life’, across the various international standards varies slightly from standard to standard, and is closely related with the concept of ‘Service Life’. What follows are the definitions of Design Life, and Service Life, from three major international bridge and construction standards. The American Association of State Highway and Transportation Officials Load Resistance Factor Design (AASHTO LRFD), the Eurocode (EN 1990.2002), and the Australian Standard for Bridge Design (AS5100.1-2004).
2.4.1 AASHTO LRFD Design Life
Design Life – “period of time on which the statistical derivation of transient loads is based”
Service Life – “the period of time that the bridge is expected to be in operation”
2.4.2 EN 1990.2002 Design Life
Design Working Life – “assumed period for which a structure or part of it is to be used for its intended purpose with anticipated maintenance but without major repair being necessary”
Reference Period – “chosen period of time that is used as a basis for assessing statistically variable actions, and possibly for accidental actions”
2.4.3 AS5100.1-2004 Design Life
Design Life – “the period assumed in design for which a structure or structural element is required to perform its intended purpose without replacement or major structural repairs”
Service Life – “a period over which a structure element is expected to perform its function without major maintenance or structural repair”
2.4.4 Database Design Life
The definition for Design Life accepted and utilised for the survey, database and this report, matches the definitions of; Service Life from the AASHTO LRFD, Design Working Life from EN 1990.2002, and Design Life from AS5100.0-2004.
To be clear, for the survey, database and this report, the definition of Design Life used was – the period of time assumed in design for which a structure is expected to be in operation with anticipated maintenance but without major repair or unanticipated structural rehabilitation.
3 THE GLOBAL LONG SPAN BRIDGE DATABASE
This section is intended to thoroughly explain the method used, and the components of the global long span bridge database created, to aid readers in understanding the database, or to assist in extending this database, or creating their own database.
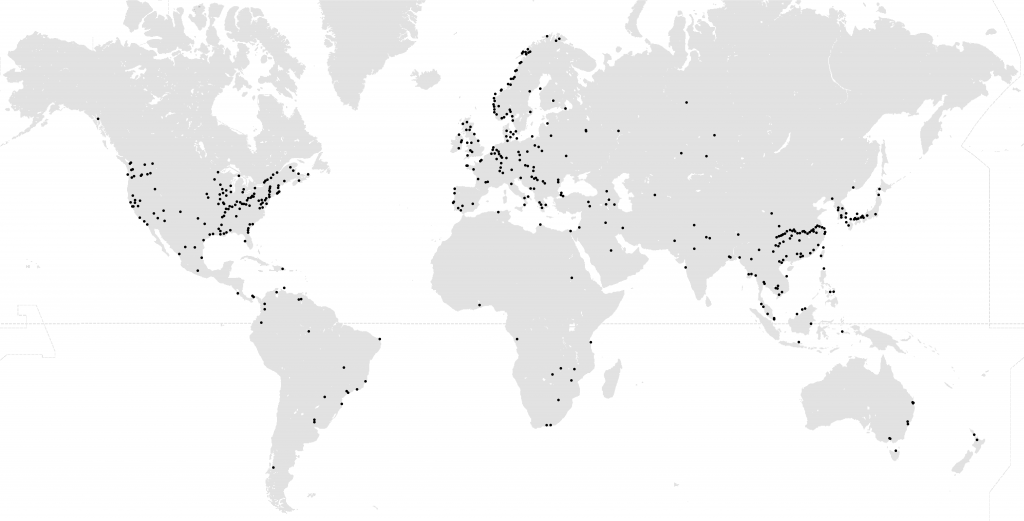
(Locations traced from Batchgeo map, using database coordinates, then composited onto a simplified global map)
3.1 Program utilised
To log the details procured per bridge from surveying various internet sources, the computer program Microsoft Access® was utilised. Access is classified as a database management system (DBMS) and was suited to the task at hand due to the programs extensive data input, organisation, exportation, and interfacing features.
3.1.1 Long span bridge form
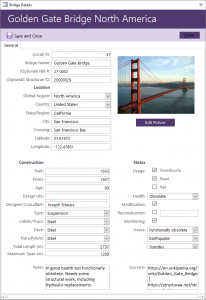
Critical to the completion of the global long span bridge database was the ability to design a ‘form’ within Access to assist in logging the details per bridge. The form is pictured below as Figure 4.
3.2 Database entries
Data entries per bridge were summarised under three sub categories; Location, Construction and Status. Other entries were present on the form to assist with administration and organisation of the database. The components within each category were as follows. Most entry fields are self-explanatory; however, several require some clarification.
Location
Construction
|
Status
Other
|
3.2.1 Construction type
Bridge type was restricted to one of five bridge type classifications; Arch, Cable Stayed, Cantilever, Suspension, or Truss. Nearly all bridges surveyed were clearly identifiable with at least one of the classifications. If the structure was a combination of more than one type of bridge then the most dominant classification or the classification of the main span was used, and the other classification(s) were included in the Notes entry field.
3.2.2 Construction material
Bridge material was separated into three entry fields; Cable/Truss, Deck, and Pier/Pylon, to allow for improved detail of which structural elements are what material in multi material bridges.
3.2.3 Bridge health status
Bridge health was restricted to three possible responses; Good, Obsolete, and Deficient, and was adopted from the National Bridge Inventory (USA). Good defines a bridge structure that does not require any immediate rehabilitation, outside of the regular maintenance schedule, and is functionally suitable for its objective. Obsolete defines a bridge that is structurally sound, and in no need of unanticipated rehabilitation, but is no longer suitable or adequate for its objective. And, Deficient defines a bridge structure that is in need of urgent structural rehabilitation, and should, either; have vehicle load restrictions, or be closed from traffic entirely, depending upon the severity of the structural issues. A bridge within the inventory both obsolete and deficient is classified as deficient only. (Federal Highway Administration, 2016)
3.3 Database sources
The required details of each long span bridge surveyed were gathered from several online resources, including;
- Wikipedia.org
- Structurae.net
- Highestbridges.com
- Bridgehunter.com
- Uglybridges.com (USA only, uses the NBI)
- Designer fact sheets/documents
Due to the National Bridge Inventory being freely available, bridges within the United States contain the most detailed and accurate entries.
All sources used, except for Uglybridges.com, were community, or crowd, collaborative efforts, and therefore the quality and accuracy of details varied greatly. To ensure bridges entered into the database were detailed as accurately as possible, the location, span, materials and usage were confirmed, when available, with satellite imagery (Google Maps), street view imagery (Google Street View), and with photographs available online.
4 Database Analysis and Discussion
4.1 Database composition
Before diving deep into analysis and discussion about the age, status, design life, in common problems, and future needs of the long span bridges, it is important to have an understanding of the distribution of both the location and bridge structure type of the long span bridges included within the database. Table 1 below displays the contribution of long span bridges from each defined global region, as well as the number of individual countries that contributed and the country within with the leading contribution. It is of no surprise that the United States makes the largest contribution of long span bridges. Surprisingly, Norway, was the largest contributor from the European theatre, and whilst not unexpected, it is still very impressive, the contribution China has made, mostly within the last two decades.

Table 2 below displays the database composition of the different bridge types, defined within the database, per region and in total. Of particular interest, the only region to make significant use of the truss and, closely related, cantilever, bridge structures for long spans is North America (United States). Also of note is the heavy use of cable stayed bridges within the Asia region. These two points of interest, are of importance, and will be recalled later in an analysis and discussion around the health and status of the long span bridges of different types.

Figure 5 below shows the distribution of long span bridge construction per global region over the last two centuries. There are several time spans of interest to note from the figure. Firstly, a dramatic increase during the 1930s within North America to combat the Great Depression as part of the Public Works Administration act (Public Works Administration, 1939), which is immediately followed by a reduction of construction during WWII and then the subsequent increase in North America and Europe immediately after. Second period of interest is the infrastructure construction boom within the Asian theatre, in line with, and most likely due to their recent economic boom. In contrast the North American region rate of construction has been declining since peaking in the 1960s.

4.2 Age and design life
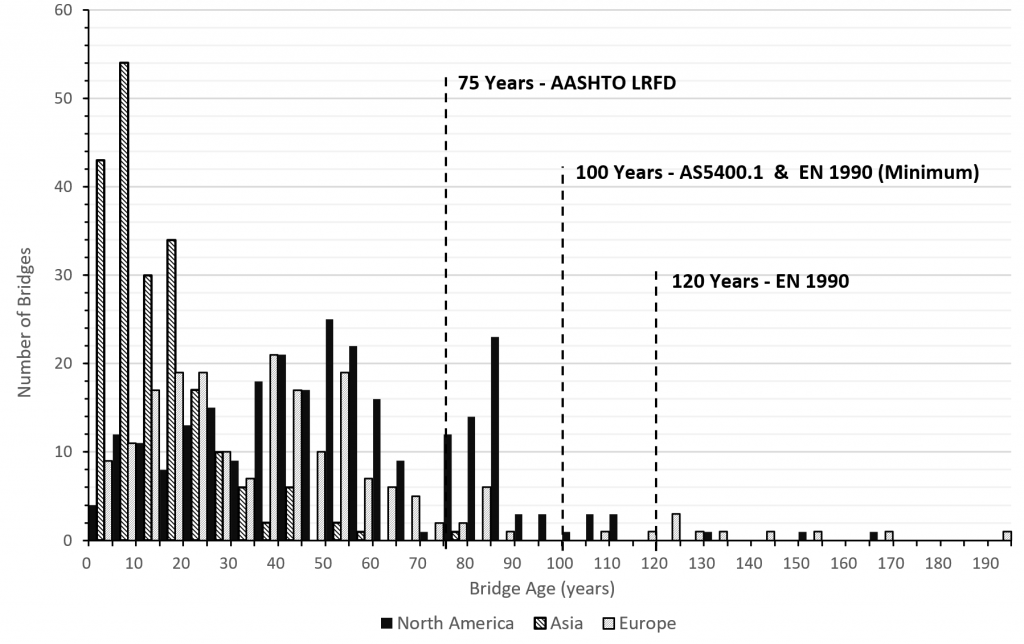
The concept of ‘Design Life’ was defined in relation to this project and database in Section 2.4.4 of this report, and was determined, from various international construction standards, to be one of three time periods. From the AASHTO LRFD 2012 for the United States and North American region, the minimum design life for a permanent bridge structure was 75 years. From the Australian Standards AS5100.1 the design life is specified as 100 years, which is also the minimum design life specified in the base Eurocode, EN 1990, and the Chinese Standards. The British Standards BS EN 1990, and many other country specific adaptations of the Eurocode, specify a design life for bridge structures of 120 years.
Using the details logged per bridge regarding age, the number of long span bridges that exist beyond each of the three design lives was determined, and has been summarised in Table 3 below.

However, it should be acknowledged that, the obtained design life values are from current editions of bridge design standards, and should only be applied to bridges constructed after the standards date of issue. Design life values from previous editions may have been greater, or lower, than current values, or the concept may not have been in consideration at all. At the time of writing this report, copies of superseded specifications have not been obtained, nor information regarding their inclusion or specification on design life.
Therefore, for the purposes of this analysis and discussion, current design life specifications have been applied and considered for all bridges.
Figure 6 below displays the distribution of bridge age within the database entries using 5-year brackets and the three major global regions (for graph clarity). The bridges built during the dramatic construction rate increase during the 1950s and 1960s, in North America and Europe, are approaching the 75-year design life, whilst long span bridges built prior to WWII have passed the 75-year life, and will be approaching 100-years within the next two decades.
4.2.1 Design Life and Rehabilitation
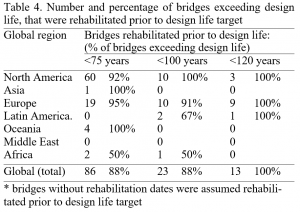
Using recorded information of whether bridges underwent major repair, or unanticipated structural rehabilitation, an indication of how many bridges that have achieved target design life can be obtained.
This has been calculated as the number, and percentage, of bridges exceeding design life, that were rehabilitated prior to design life targets, and is summarised below as Table 4. It is clearly apparent that for the majority of bridges that have exceeded target design life periods, structural rehabilitation has already been performed, and thus target design life, in accordance with the current definition, was not achieved. Only 8% of North American bridges, 5% of bridges in Europe, and collectively 12% of the global total, beyond the AASHTO LRFD specified design life of 75-years, were not structurally rehabilitated prior to reaching the 75 years of age.
4.3 Status and common problems
Using information regarding; global region, bridge type, bridge health status, and bridge rehabilitation data, correlations can be drawn and conclusions made upon the status of the long span bridges around the globe, and the common problems that affect them.
Table 5, below, summarises the health classification per global region as the percentage of bridges within each region. It is important to note that the National Bridge Inventory provided extensive information regarding the health and status of long span bridges located within the United States, which has likely affected results. However, given the fact that the United States contains the oldest collection of long span bridges, the indication from Table 5 that the North American region contains the highest percentage of structurally deficient bridges is not surprising.

The American Society of Civil Engineers has been publishing yearly Infrastructure Report Cards for the United States for several years now, and recorded that 9.4% of all bridges within the United States were classified as structurally deficient, which closely matches the determined percentage of structural deficient long span bridges within the North American region of this database. However, the latest Infrastructure Report Card reported that only 13.6% of United States bridges were classified functionally obsolete, while 27.4% of North American long span bridges within the database were classified as functionally obsolete. (ASCE, 2017)
A possible reason for the high rate of obsolete classifications amongst long span bridges within the United States is that long span bridges have a higher tendency to be placed along critical transportation routes, and the United States over reliance upon road vehicles for transportation does not assist the traffic capacity requirements of the long span bridge.

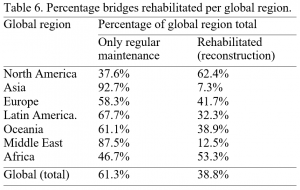
Figure 7 above, and Table 6 below, display information regarding the structural rehabilitation and global region location of long span bridges. Figure 7 displays bridges per decade of construction that have been rehabilitated, which if viewed alongside Figure 5, in Section 4.2 of this report, and Table 6 below gives clear justification as to why the region rehabilitation percentage, of 62.4%, for North America is so high. Majority of bridges rehabilitated originate from the same time period in which North America’s long span bridge construction peaks.
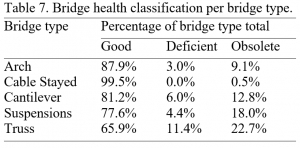
If bridge type is now taken into consideration with both Table 7, bridge health classification per bridge type totals, and Table 8, bridge rehabilitation percentage per bridge type totals (both tables on the following page), further justification as to why the North American region has the highest percentage of structurally deficient long span bridges becomes apparent. Table 7 displays that the truss bridge type is the bridge type with the highest percentage of structurally deficient bridges, and cantilever being the second highest. Likewise, Table 8 displays that the truss and cantilever bridge types are the bridge types with the highest percentage of structural rehabilitation.
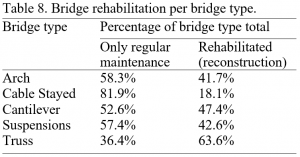
Therefore, as the North American region is the region with the highest number of cantilever and truss bridge types, it is understandable that the region has the highest percentage of structurally deficient and rehabilitated long span bridges.
And, from Figure 8 below an indication as to why it is that truss and cantilever long span bridges have the highest percentage of deficiency and rehabilitation is given.
From Figure 8, it can be seen that, the percentage of bridge types affected by corrosion, wearing, capacity and overloading are highest for cantilever and truss long span bridges.

These results are in line with findings that were published in a 2011 ASCE journal performance review of all bridge types and bridges within the United States, using the U.S bridge inventory (NBI). It was concluded that truss bridges have the lowest condition performance, and in general it was concluded that the average bridge life till major rehabilitation was 63% of the objective 75-year design life. (Farhey, 2011).
If truss, cantilever and arch types are removed from the health classification and rehabilitation calculations per region, it is expected that the percentage of deficient North American bridges (Table 5) and percentage of rehabilitated North American bridges (Table 6) will decrease. This proves to be true, although, possibly for alternative reasons. If only cable stayed and suspension bridges are considered, percentage deficient and percentage rehabilitated bridges in the North American region fall to 6.3% and 56.3%, respectively, closer to the international results. However, in Table 9 the percentage of each bridge type number total per 10-year age bracket is summarised, and it can be seen that the truss bridge type is, collectively, the oldest bridge type, with an average age of approximately 52 years, with cantilever and suspension close behind.

5 FUTURE NEEDS, REVIEW AND RECOMMENDATIONS
5.1 Future needs of long span bridges
The present conditions within United States can be used to understand the future requirements of long span bridges around the globe. Except for China and Norway, most countries and individual managing bodies, do not have an infrastructure comparable to the United States, however, the treatment and monitoring of ageing bridges is comparable no matter the number of bridges. The ASCE estimated, in their most recent infrastructure report for the United States that the nation’s backlog of bridge rehabilitation requires $123 billion (USD) to clear. (ASCE, 2017) Though this amount is for all bridges, regardless of span length, within the United States, it is still a warning as to the cost of neglect to bridge structures.
Closures on any bridge are disruptive and costly to both the managing body and the surrounding population. This cost is amplified for vital connections, which are often provided by long span bridges. Therefore, it is essential that future long span bridges are designed with the expectation of regular and unexpected maintenance, and that they are designed towards ease of accessibility and upgradeability.
For the ageing, long span bridges within North America, an effective replacement method for severely deficient, obsolete or outdated bridges needs to be devised. The ongoing maintenance costs of the high number of truss, cantilever and arch bridges within the United States can surely be mitigated by commencing their replacement with modern and more durable bridge technologies.
The average age of cable stayed structures is very low in comparison to the other bridge types, though so far the health and rehabilitation rate have been promising. Moving forward cables stayed bridges need to be closely monitored and documented, particularly within the Asian theatre.
Also after conducting this survey and database creation, it should be noted that higher standards in archiving of bridge information needs to be achieved, and if possible publicised. The NBI for the United States was an invaluable resource during this project, and so it is encouraged that other regions and countries around the globe share similar bridge inventory information. With more information, a deeper, more accurate, and meaningful analysis can be conducted, especially outside the United States.
5.2 Database review and recommendations
The database constructed for this investigation into long span bridges from across the globe has established a strong foundation, and it is recommended that the database be expanded in the future. However, expansion in terms of the quantity of bridges within the database should not be priority, instead, the database detail and scope of information per bridge needs to be improved. There is potential for far deeper and meaningful analysis in regards to the performance of long span bridges. It is recommended that details added include; side span lengths, number of spans, construction cost, maintenance costs, construction technique, traffic information, and design loading. Also, demolished long span structures, were omitted from the survey and should be added to the database.
6 CONCLUSION
The survey conducted and the subsequent database constructed were essential to the breakdown and analysis of long span bridges from around the globe. Whilst analysis has been completed, and valid points drawn regarding the age, design life and status of long span bridge structures, there is a need for more outside the United States. It can be concluded that the database created and used is a good foundation for further detail and expansion.
The concept of design life creates an interesting discussion about the expectations of how long a bridge should exist and how well it should perform. Till recently bridge construction has been doing the best we can with what is available, however, with recent strides towards sustainability, achieving the definition of design life is looking more promising than the last half century performance of long span bridge structures.
7 REFERENCES
American Association of State Highway and Transportation Officials. (2012). AASHTO LRFD Bridge. Washington: American Association of State Highway and Transportation Officials.
ASCE. (2017). 2017 Infrastructure Report Card: Bridges. Retrieved from Infrastructure Report Card: http://www.infrastructurereportcard.org/cat-item/bridges/
Euorpean Committee for Standardization. (2004). Eurocode – Basis of structural design. Brussels: Euorpean Committee for Standardization.
Farhey, D. N. (2011). Operational Structural Performances of Bridge Types. Reston: American Society of Civil Engineers.
Federal Highway Administration. (2016, December 31). Bridges and Structures: Frequently Requested NBI Information. Retrieved from Federal Highway Administration: https://www.fhwa.dot.gov/bridge/britab.cfm
Hewson, N. R. (2003). Prestressed concrete bridges: design and construction. Cornwall: Thomas Telford Limited.
Kratky, R. J. (2004). Assessment of Performance of Vital Long-Span Bridges in the United States. Reston: American Society of Civil Engineers.
Public Works Administration. (1939). America builds: The record of PWA. Washington: U.S. Government Printing Office.
Standards Australia. (2004). AS5400.1-2004 Bridge design. Sydney: Standards Australia.